Brandhaardjes: protests and riots on a map, collected by AI
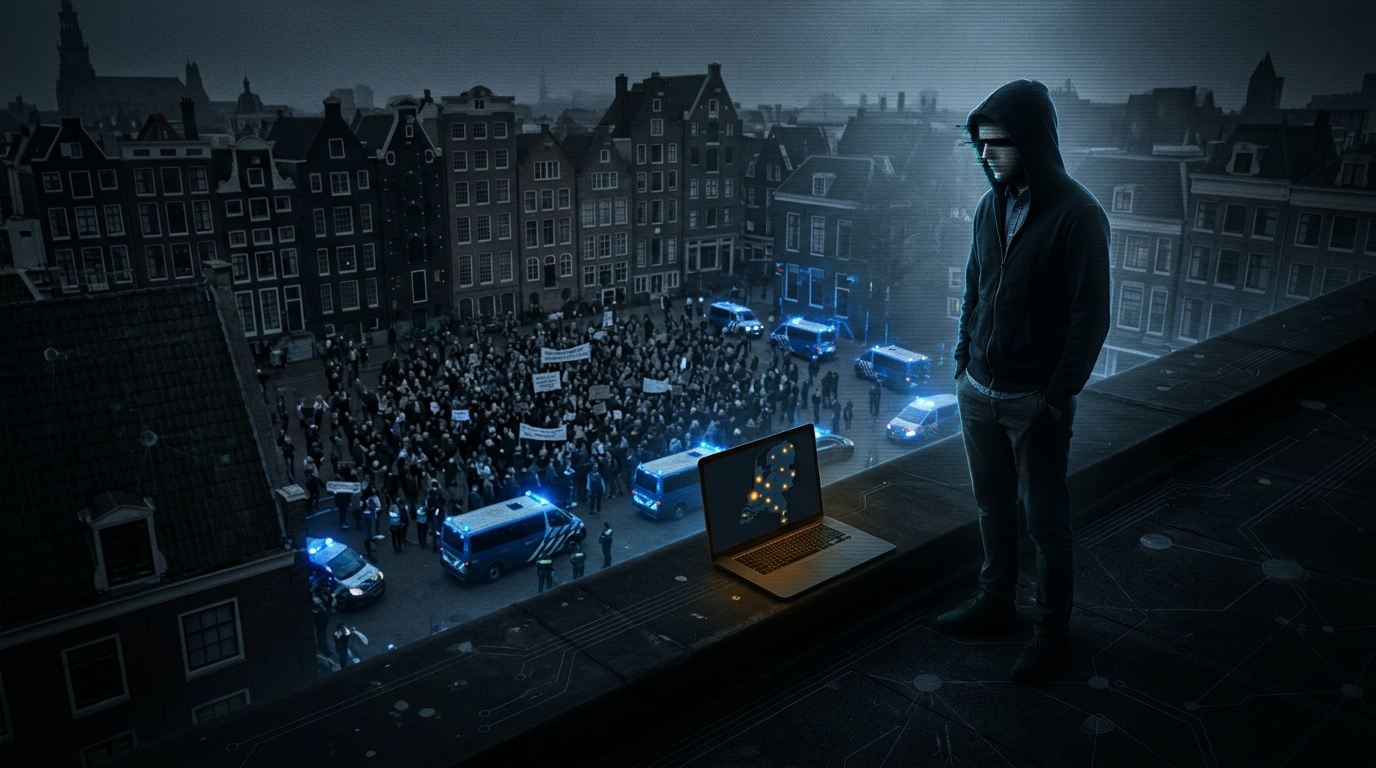
It started with a discussion about physical security. You have a meeting at a client, a visit to an office, or just a day out. Then it turns out there’s a protest at the front door that afternoon, a blockade on the route, or worse: riots nearby. Business or private, it affects your visit. Why do we usually only find out once we’re already there?
So I built brandhaardjes.nl. As a test, really just a test, but also to brush up my programming skills. The name is Dutch for “little hotspots”.
What it is
A map and timeline of protests, riots, blockades, occupations, strikes and commemorations in the Netherlands. Collected every half hour from open sources: municipal gazettes, police and prosecutors, national and regional media, and activist calendars. For each event you see what, where and when, how reliable the source is, and how much disruption to expect.
The OSINT part
At its core this is plain OSINT: only public sources, nothing you couldn’t find yourself. The difference is the tradecraft around it. Every source gets a reliability grade, every news article is saved to the Internet Archive so you can still check it later, and the collected data is public as JSON. What an analyst does by hand (search, weigh sources, record, map) happens here automatically every half hour.
Where the AI is
This is mostly a test project. The real question: how far do you get with AI in collecting and analysing data?
- Reading: a language model (currently Claude) reads news reports and extracts only facts that are literally stated. What, where, when, arrests, cancelled.
- Grading: not the AI. The program computes reliability itself, with fixed rules based on the Admiralty code. A municipal gazette is A, an unknown activist calendar D.
- Summarising: the language model writes the short summaries.
That split is deliberate. Let the model do what it’s good at, reading text, and keep the judgment in rules you can check.
What it isn’t
Automated reading sometimes goes wrong: a wrong place, date or type of event. Media attention is not incident frequency. More dots in Amsterdam doesn’t mean more protests, just more coverage. And five regional sites copying the same ANP report still count as five sources.
Two principles are fixed. Brandhaardjes is about events, not people: no names of private individuals, no photos of participants. And the disruption level never depends on the topic. A protest is a fundamental right, not a threat.
Try it
The map is in Dutch; the method is also in English. Use it as a starting point, not as the truth: always read the source.
Want to help, have tips, or spotted a mistake? Send me a message on LinkedIn.